![[ XTcpdump ]](tcpdump-logo.jpg)

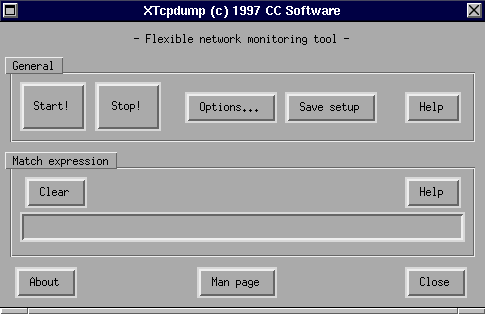
The important buttons in the main window are:
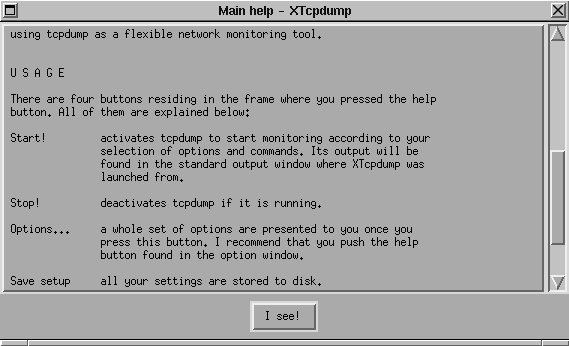
| Start! | activates tcpdump to start monitoring according to your selection of options and commands. Its output will be found in the standard output window where XTcpdump was launched from. |
| Stop! | deactivates tcpdump if it is running. |
| Options... | a whole set of options are presented to you once you press this button. I recommend that you push the help button found in the option window. |
| Save setup | all your settings are stored to disk. |
| Clear | clears the expression entry field. |

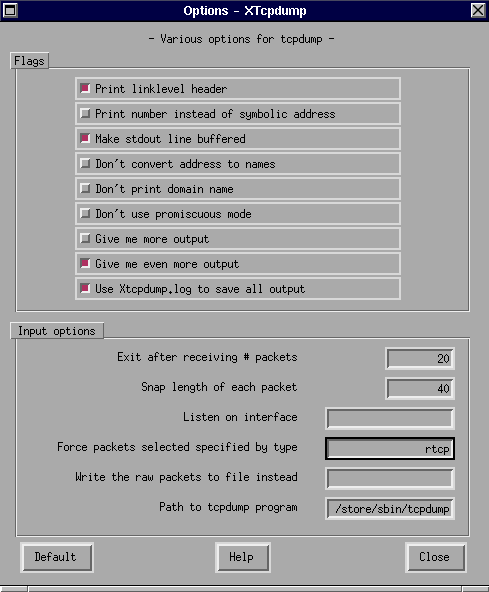
The important buttons and fields in the options window are:
| Print link level header | prints the header on each dump line |
| Make stdout line buffered | print 'foreign' addresses numerically rather than symbolically.
Sun's yp server? use it! |
| Make stdout line buffered | make stdout line buffered. Useful if you want to see the
data while capturing it. |
| Don't convert address to names | doesn't convert addresses (i.e. host addresses, port
numbers, etc.) to names. |
| Don't print domain name | doesn't print domain name qualification of host names.
'slibo.cc.uit.no' will be 'slibo', as an example. |
| Don't use promiscuous mode | doesn't put interface into promiscuous mode. Note that the
interface might be in promiscuous mode for some other reason. |
| Give me more output | slightly more verbose output. |
| Give me even more output | a lot of output. |
| Use Xtcpdump.log to save
all output |
saves all the output from the tcpdump program onto disk.
Check the file Xtcpdump.log afterwards. |
| Exit after receiving # packets | will exit tcpdump after receiving a given number of packets. |
| Listen on interface | listen on interface. If unspecified, tcpdump searches the system interface list for the lowest numbered, configured up interface (excluding loopback of course :). |
| Force packets selected
specified by type |
packets selected by "expression" are of this type. rpc (Remote Procedure Call), rtp (Real-Time Applications protocol), rtcp (Real-Time Applications control protocol), vat (Visual Audio Tool) and wb (distributed White Board). |
| Write the raw packets to
file instead |
write everything to disk instead of parsing it. Really "dumps" it all on disk consuming a lot of disk space. |
| Path to tcpdump program | the path to the necessary tcpdump program |
| Default | bring back factory settings. |

Edit the Tcl code if your wish interpreter is
found elsewhere than /store/bin/wish.
There shouldn't be any need to edit the Tcl code further to customize the
program. All of this should be able to in the program's configuration window.
XTcpdump saves its configuration to the xtcpdump.rc
file.
The launching of the required program, tcpdump (1), might be the only part of this program that is a bit difficult to understand. To avoid using extended Tcl code, the program creates a Bourne Shell script with the appropriate arguments to run the tcpdump program. The PID for the script being run is saved in a Tcl variable. When the user hits the stop button, this particular PID is killed removing its child process, tcpdump.
Go to the download section to start downloading.